Usage records
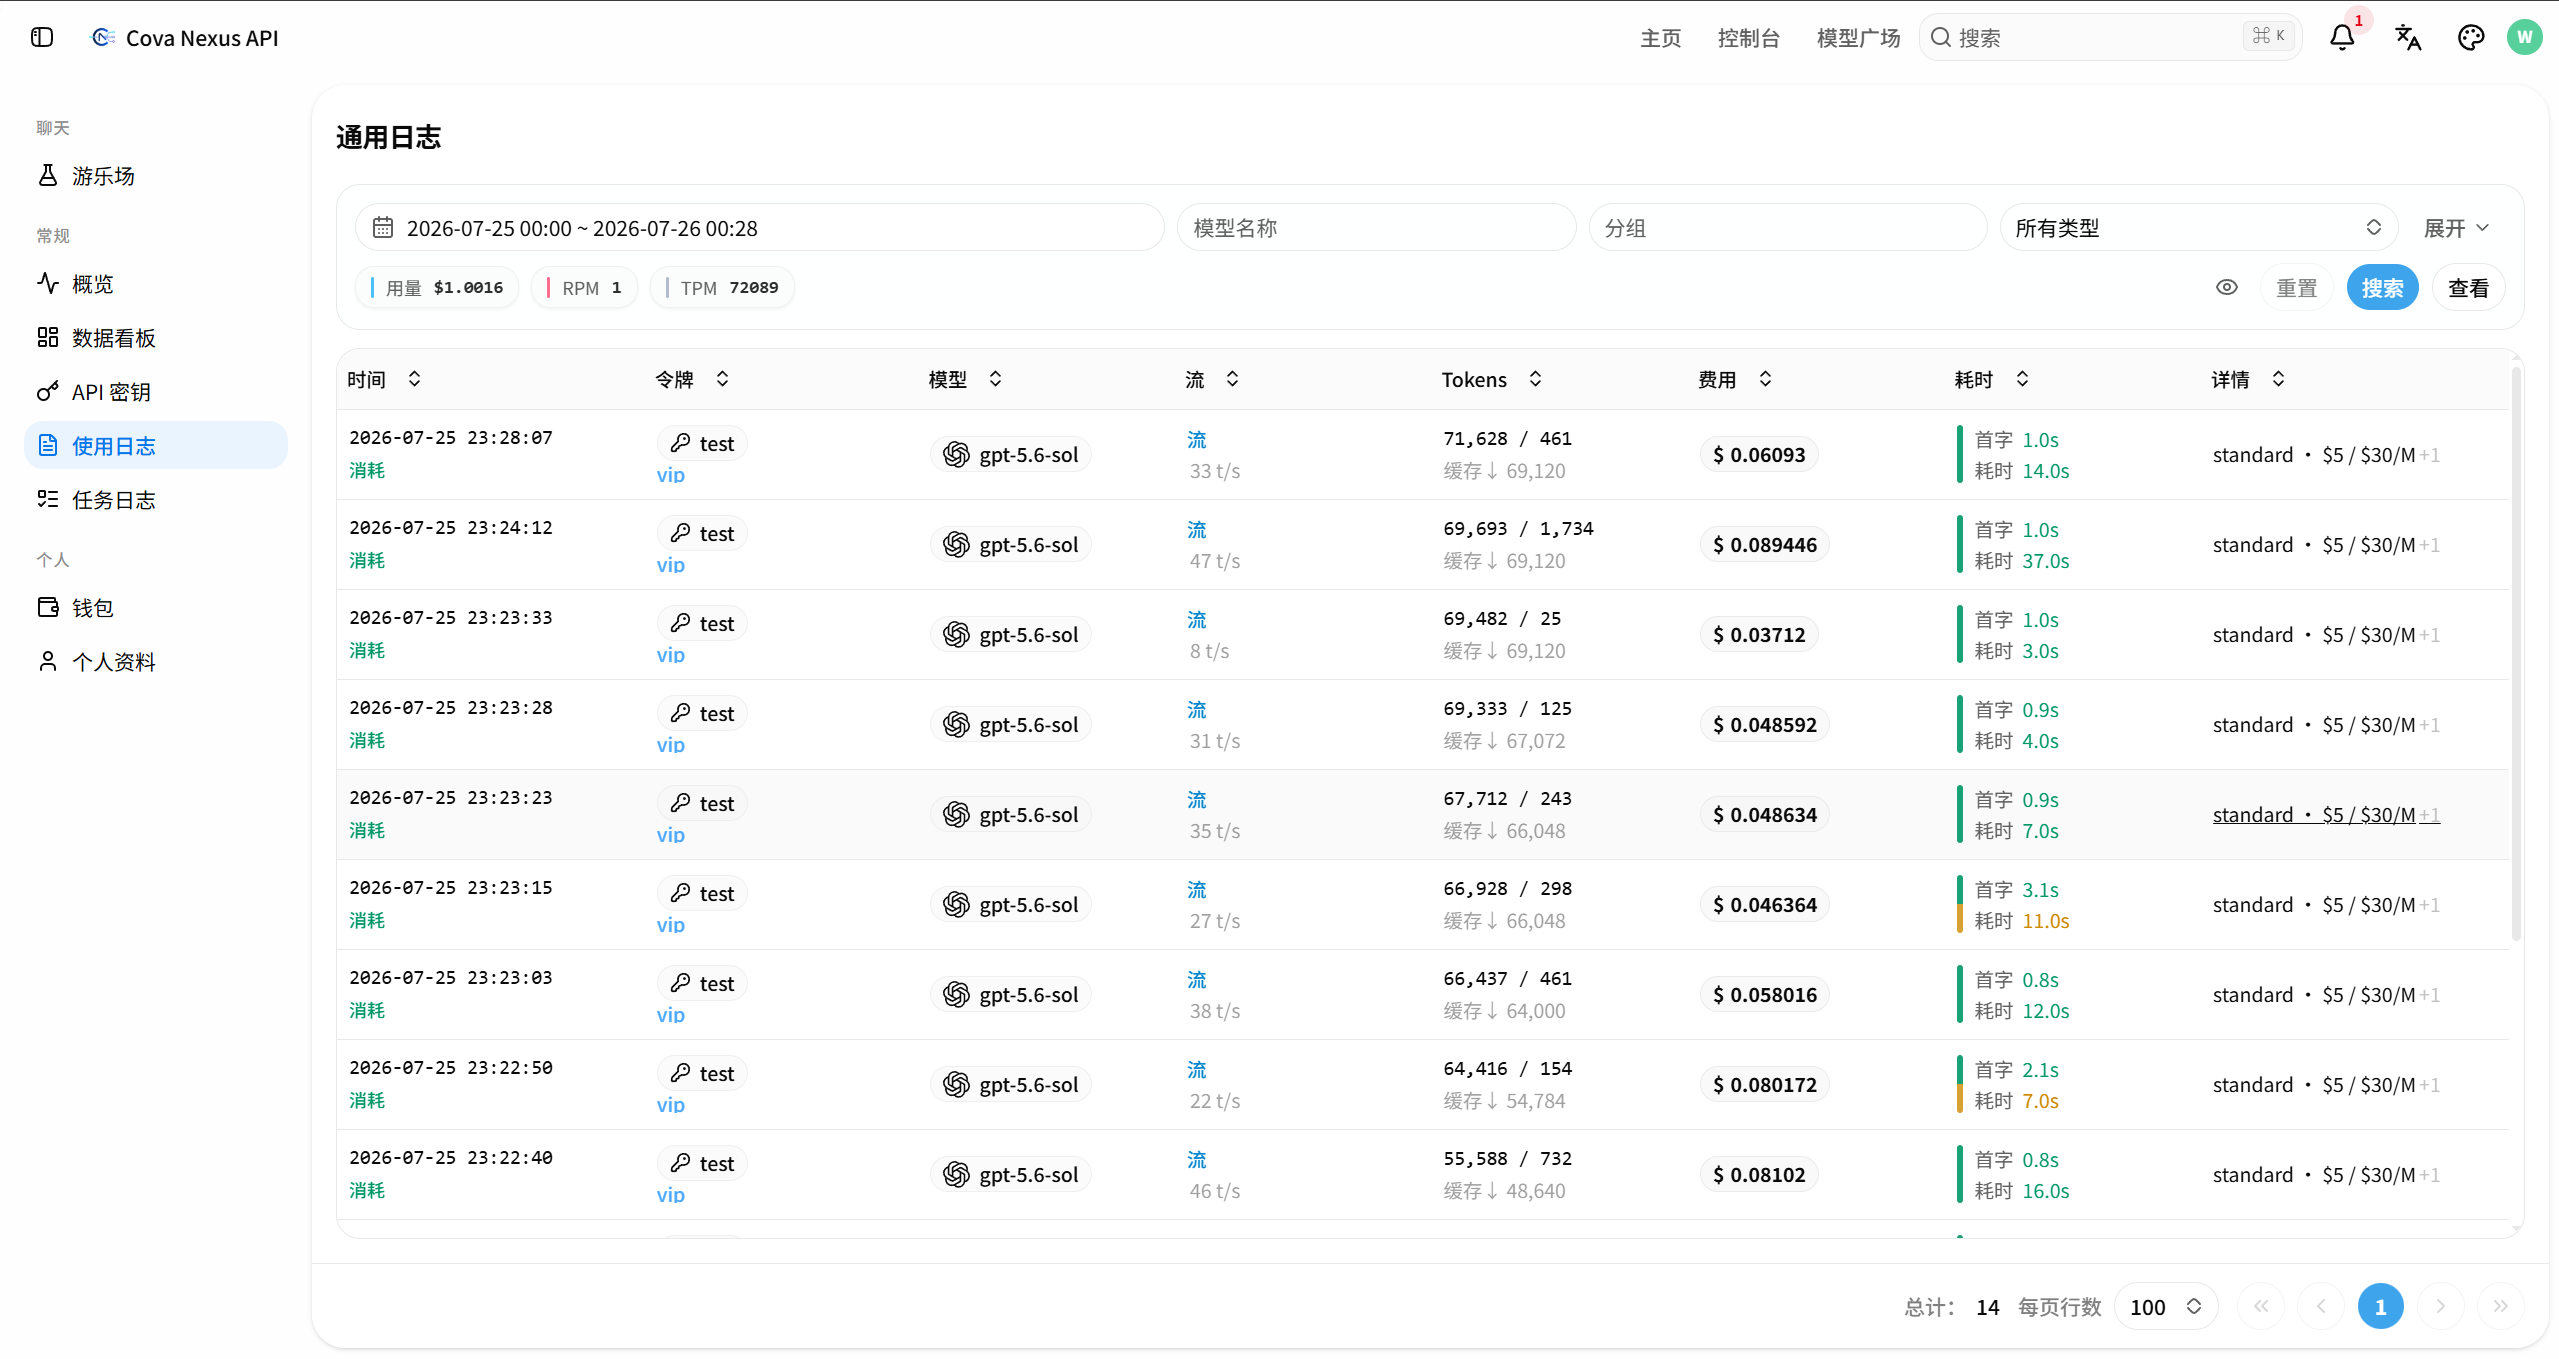
View the details of each API call and support filtering by time, model, token, etc. Click "Logs" in the left navigation, or visit /usage-logs/common directly.
Each line of the log list displays a call record, including the call time, model used, consumed Token quantity and quota, call status and other information.
Search and filter
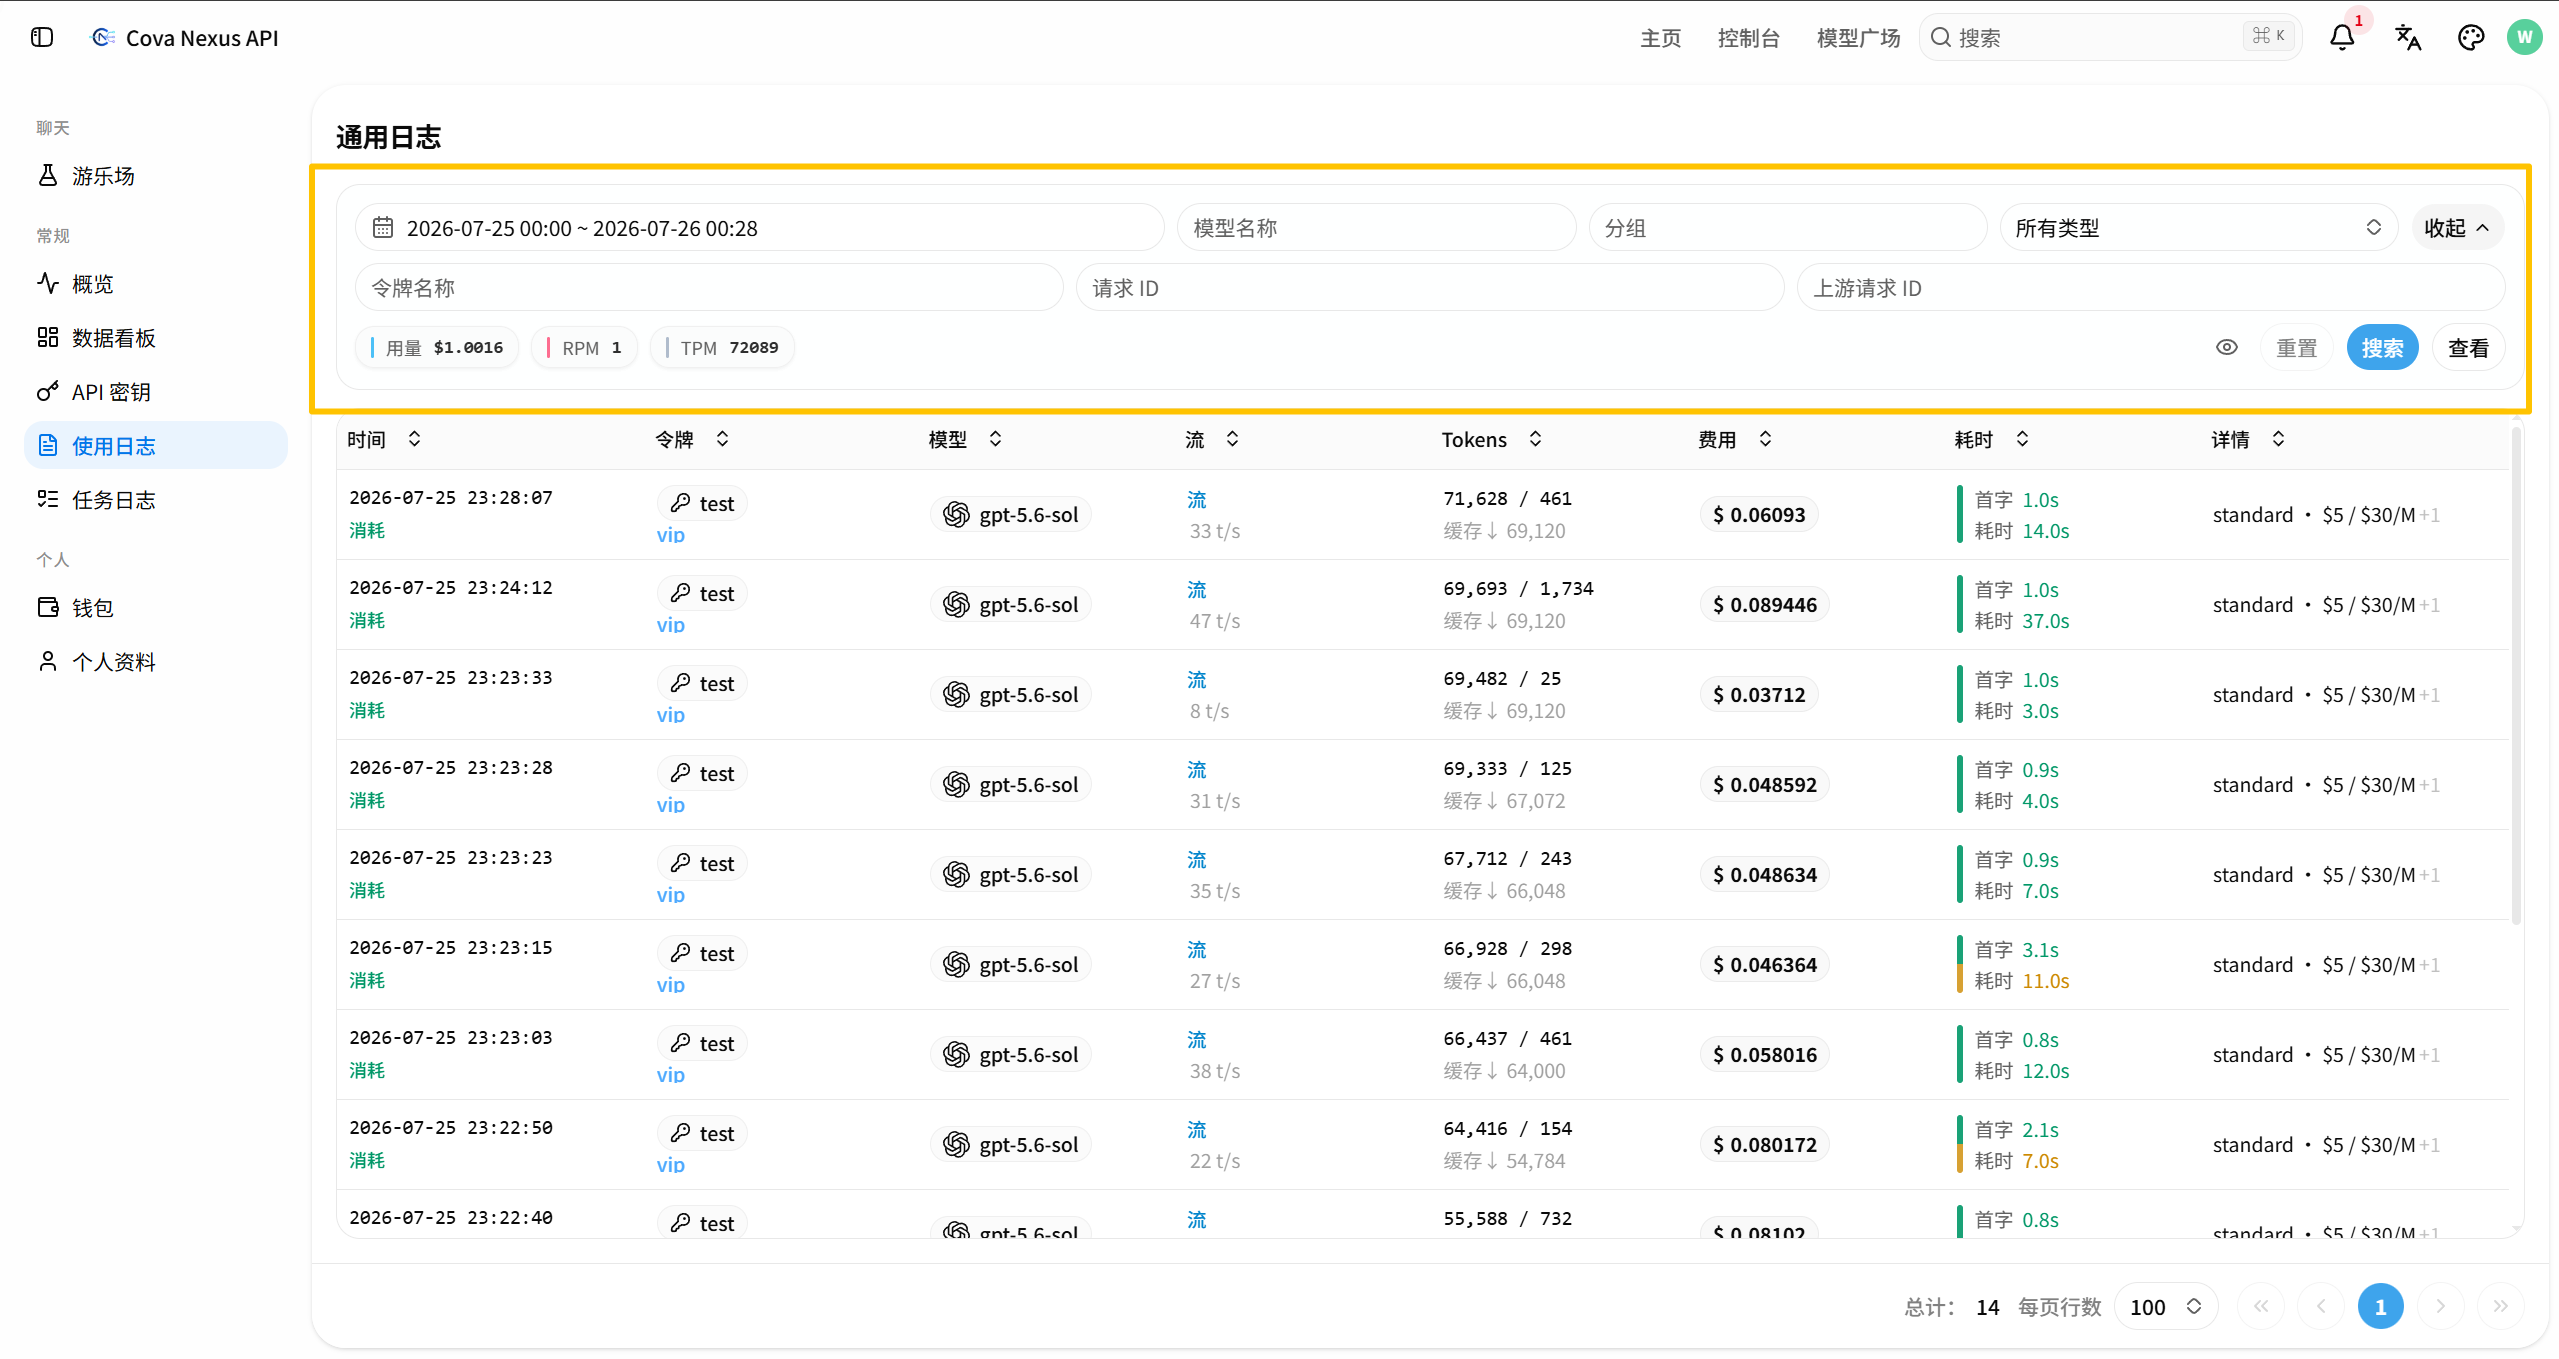
Set filter conditions
Click the "Filter" button at the top of the log page to expand the filter criteria area.
The following conditions can be set: time range (select the start and end dates), model (enter the model name keyword), token name (select or enter the token name)
After completing the settings, click "Query" and the list will automatically refresh to display the filtered results.
View filter results
After completing the settings, click "Query" and the list will automatically refresh to display records that meet the conditions. It supports turning pages to view more results, and you can also adjust the filter conditions and query again.
Statistics
Access data dashboard
Click "Data Dashboard" in the left navigation, or visit directly /dashboard/models
View statistical charts
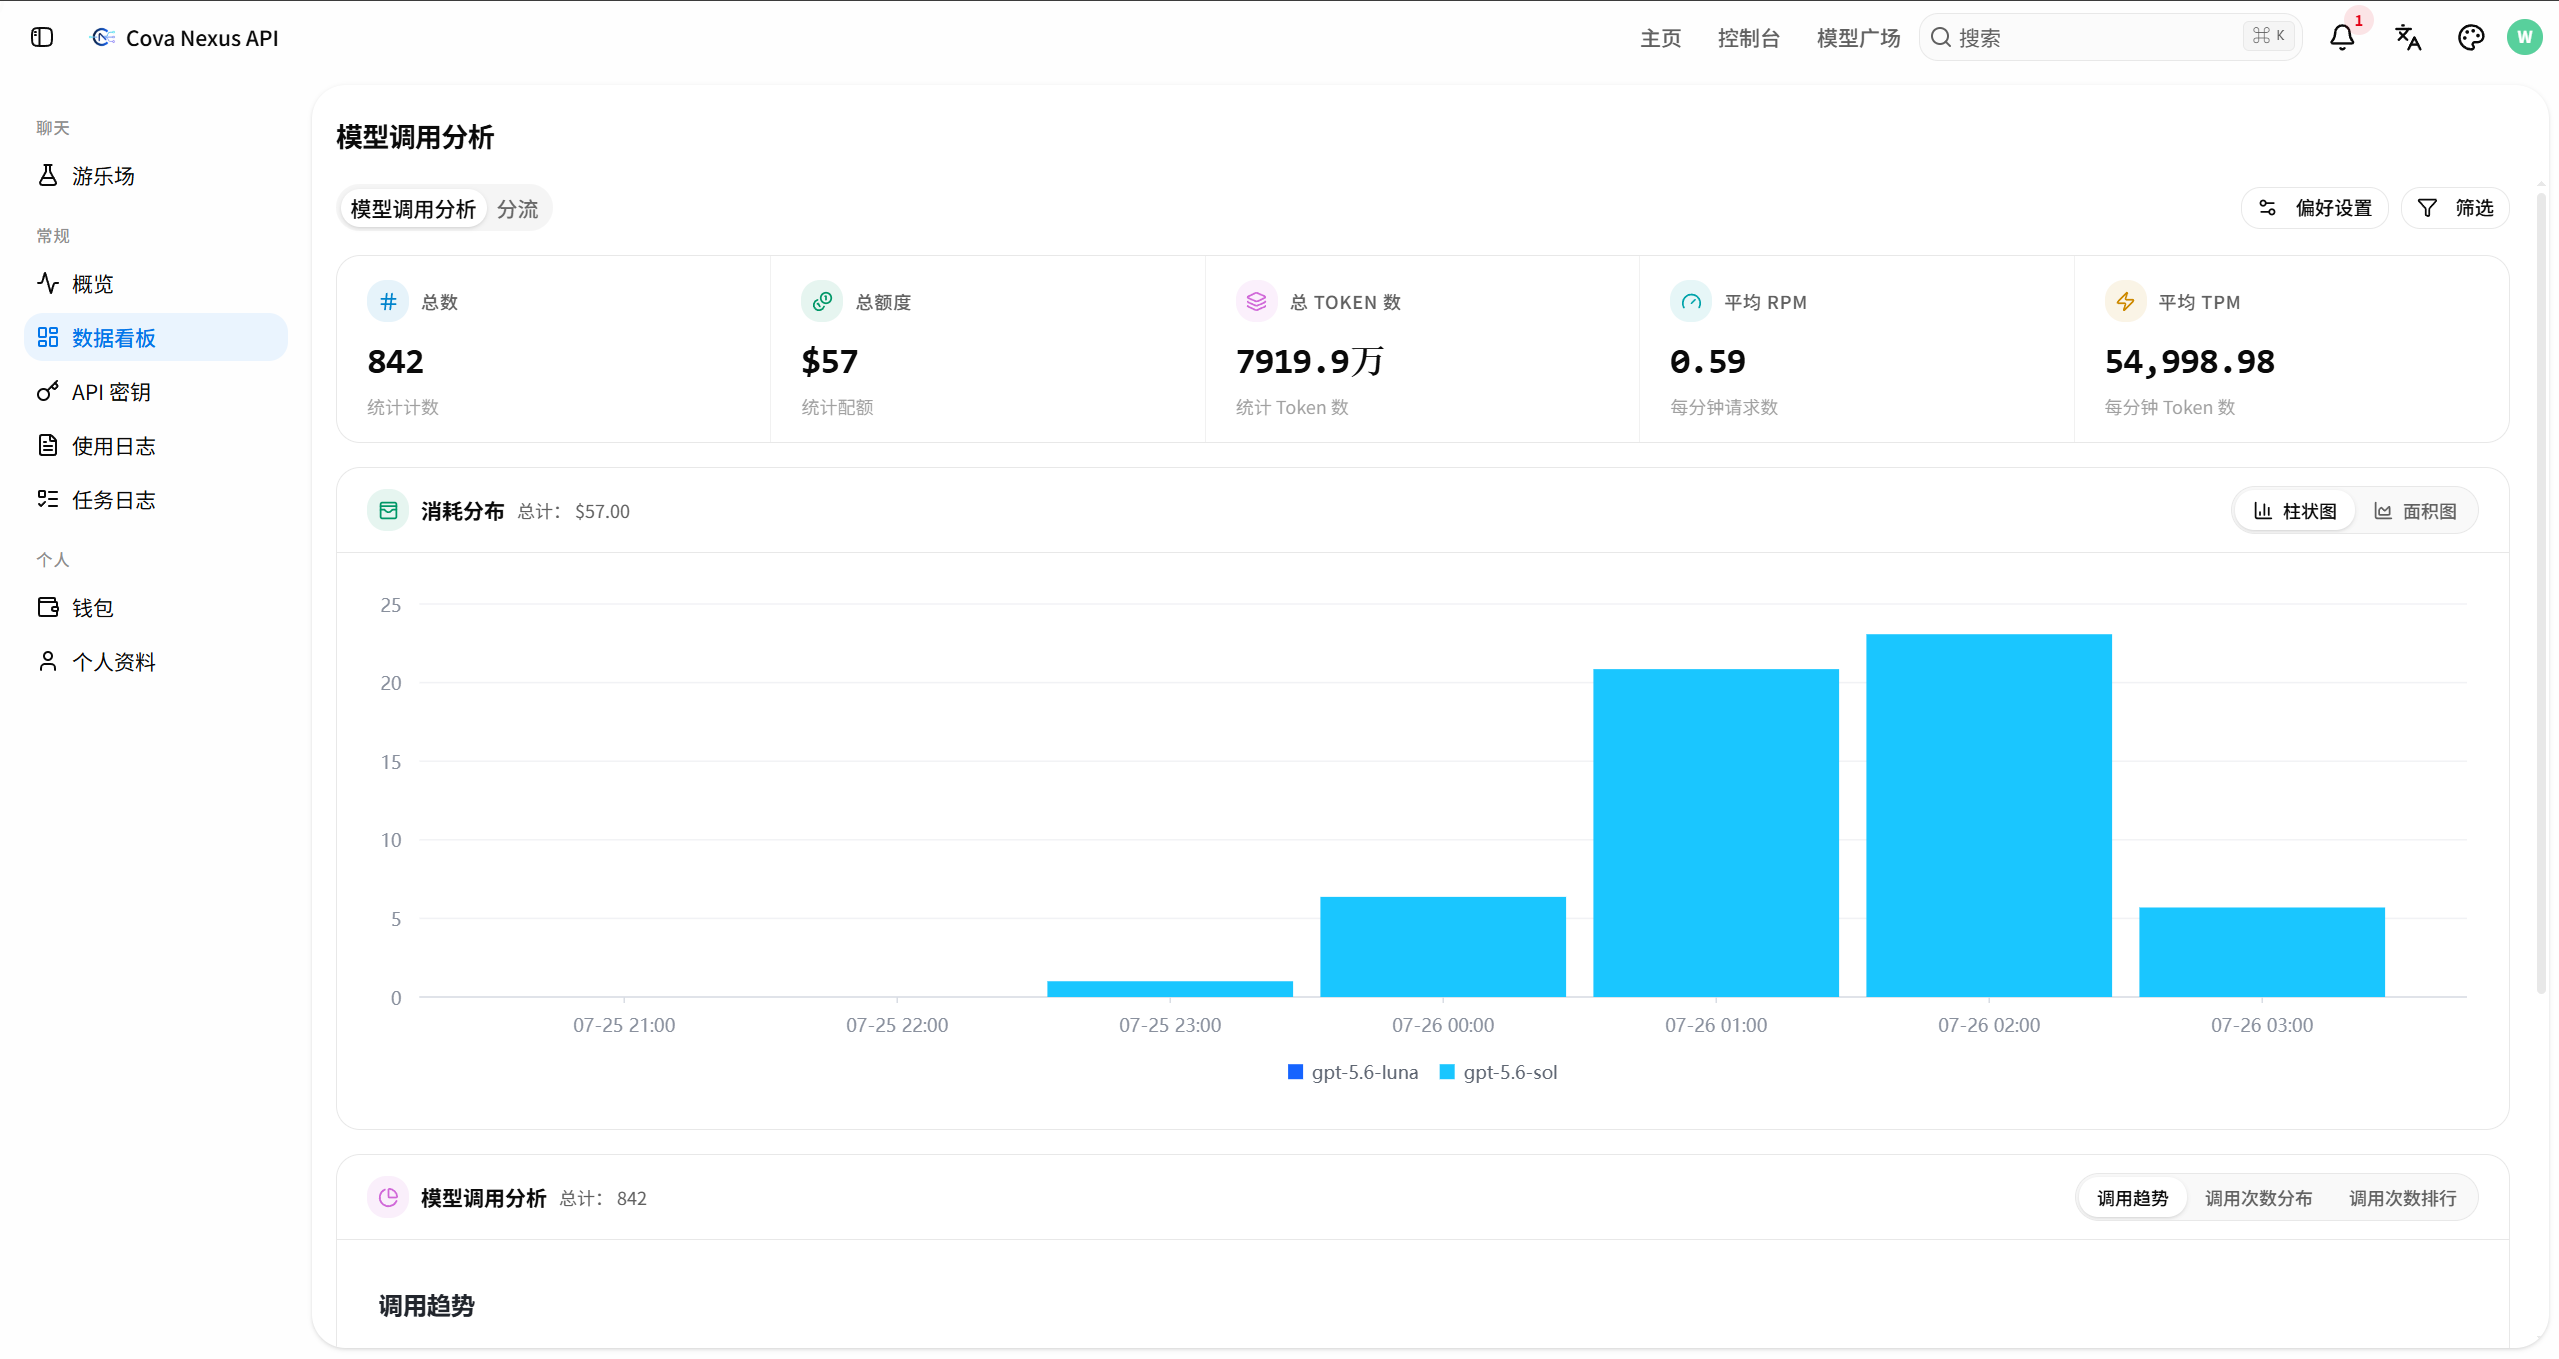
The data dashboard page displays daily API call volume and quota consumption trends in line charts or bar charts. Hover over the chart to see detailed data for specific dates.
- View call volume trends by day/week/month
- Statistical consumption by model classification
- Usage statistics by token classification
- Real-time updates, data delay does not exceed 1 minute